Dashboards I use for Grafana
| img | ||
| json | ||
| LICENSE | ||
| README.md | ||
Tableaux de bord pour Grafana
Les tableaux
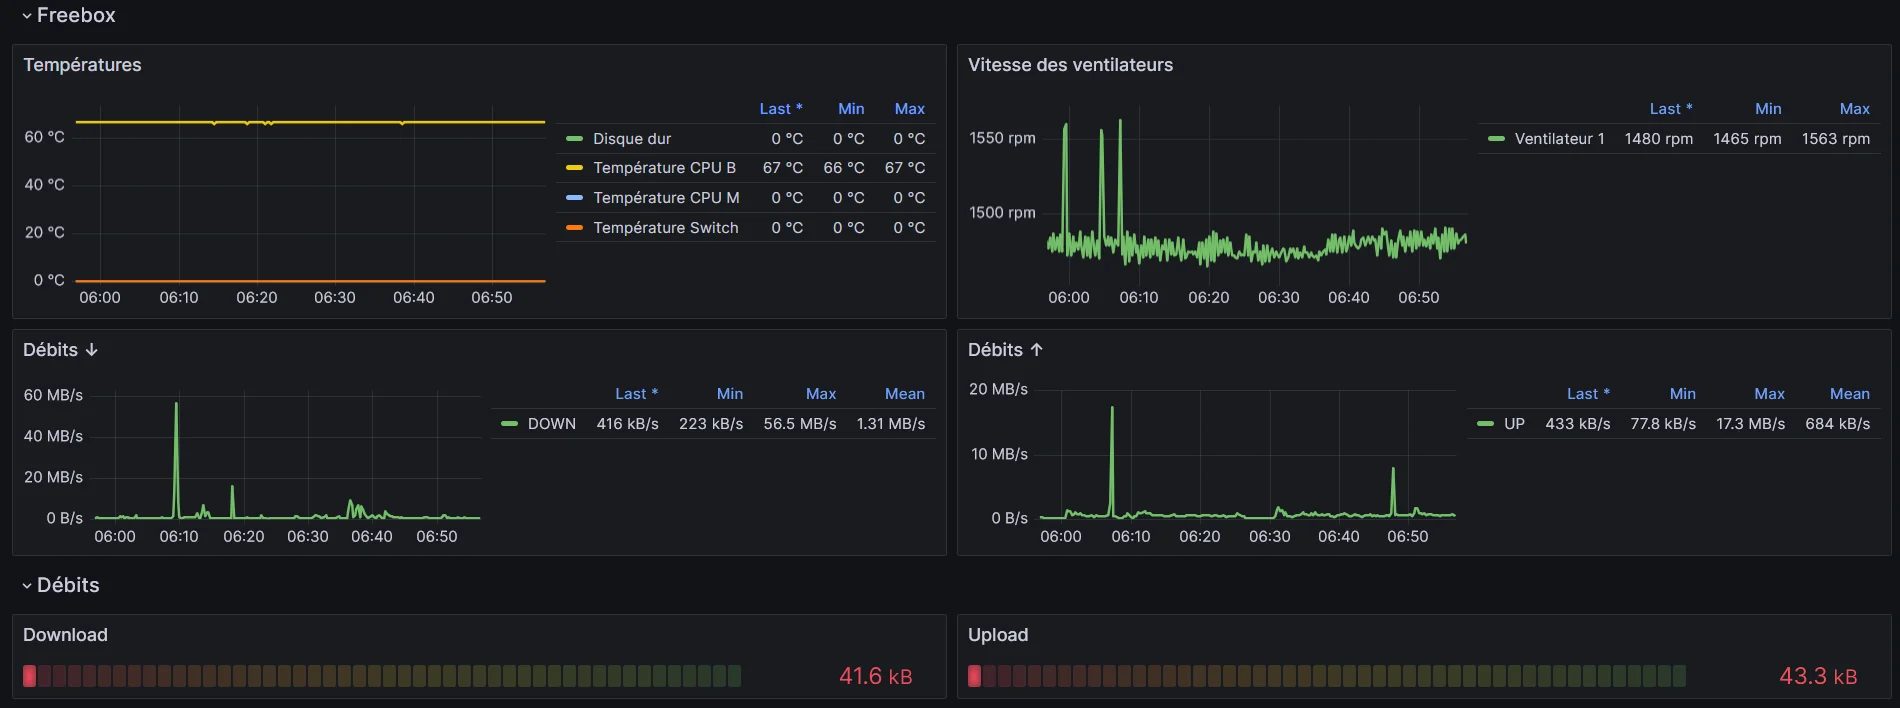
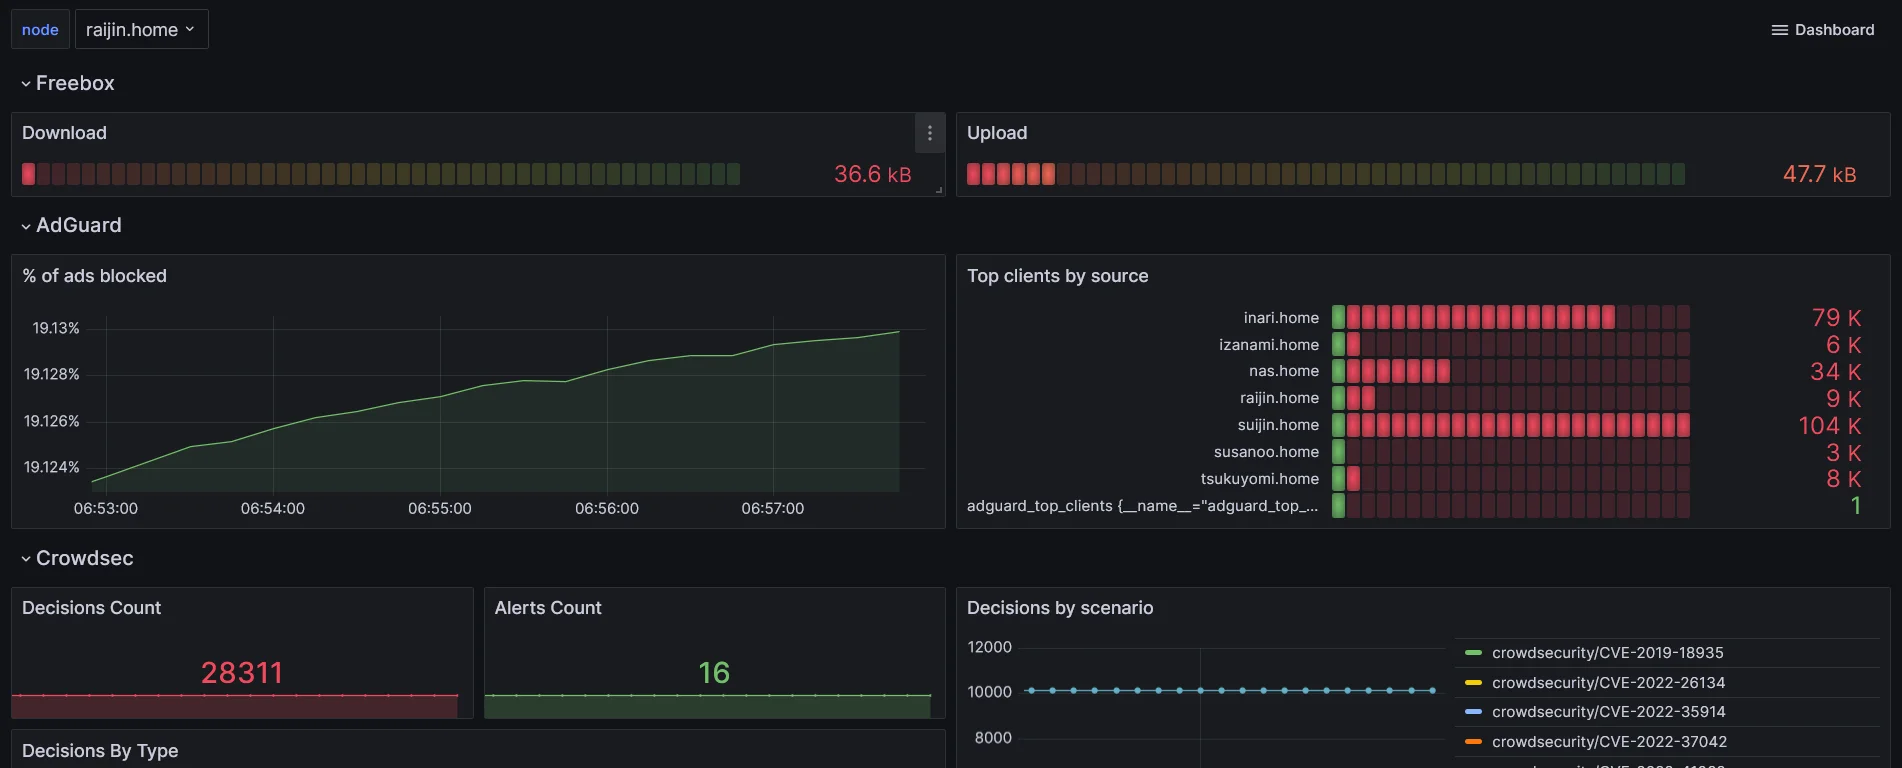
Freebox
freebox-exporter
 Json
Json
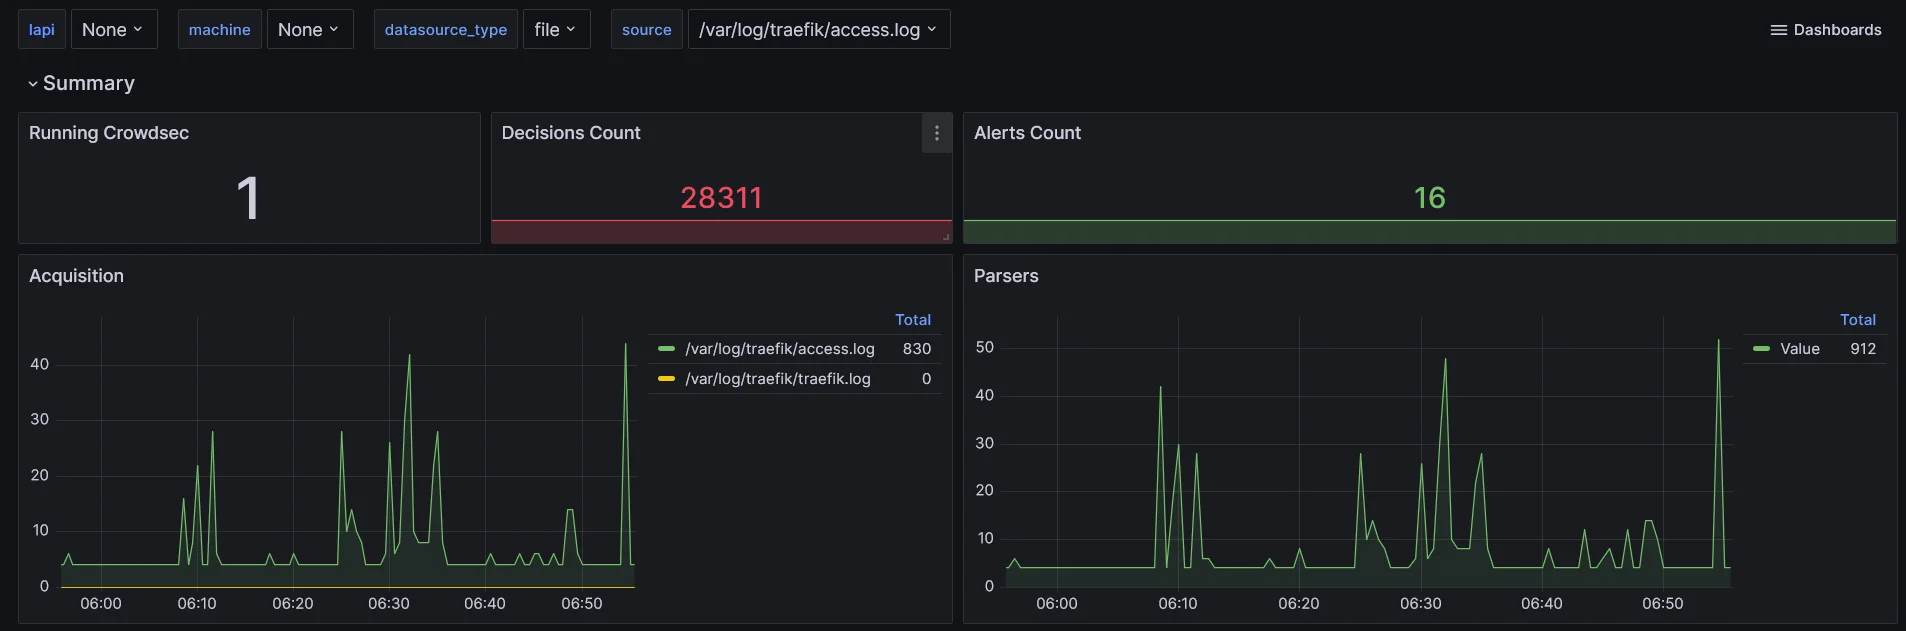
Crowdsec
crowdsec/config.yaml : prometheus
 Json
Json
Crowdsec CTI
utilise une notification Crowdsec + Victoria Logs
 Json
Json
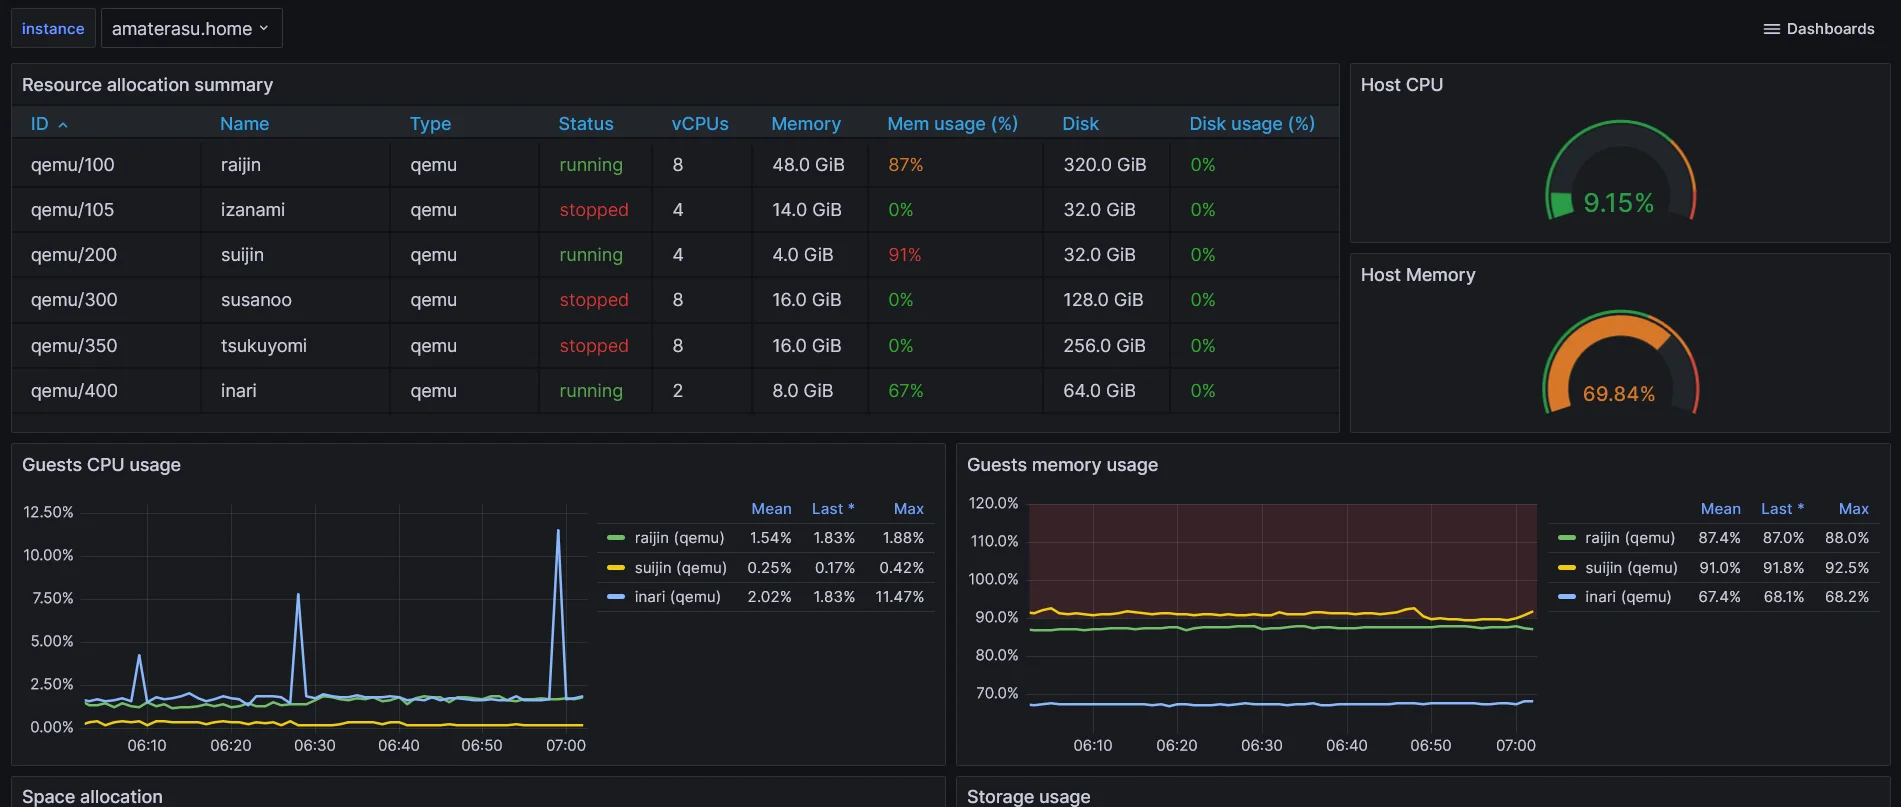
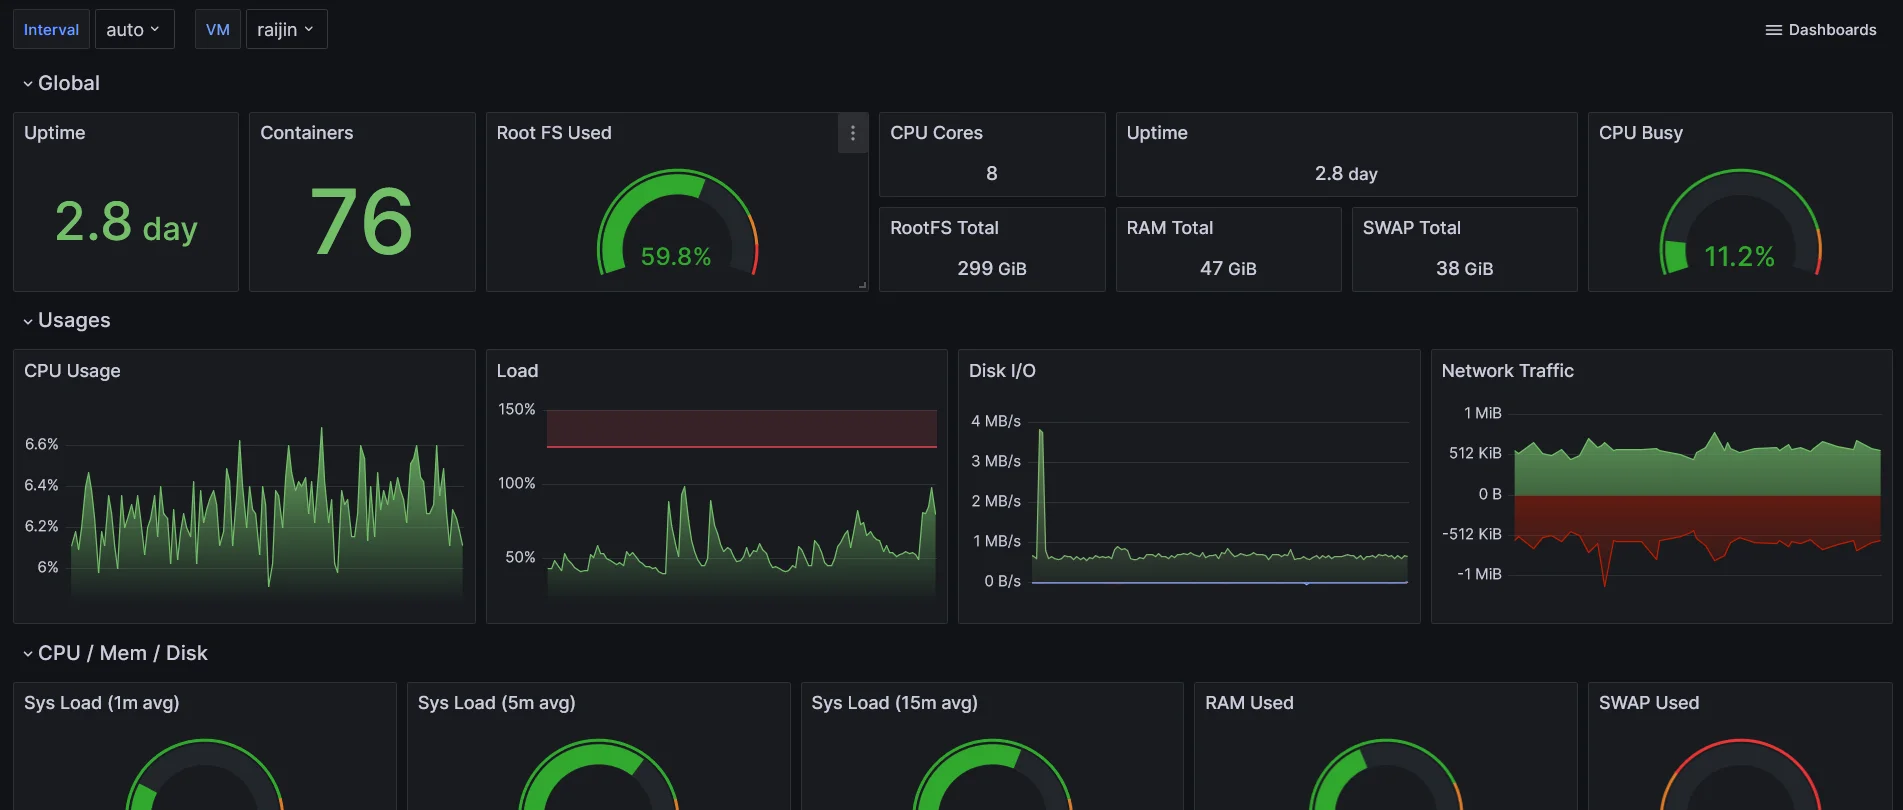
Proxmox
prometheus-node-exporter et prometheus-pve-exporter
 Json
Json
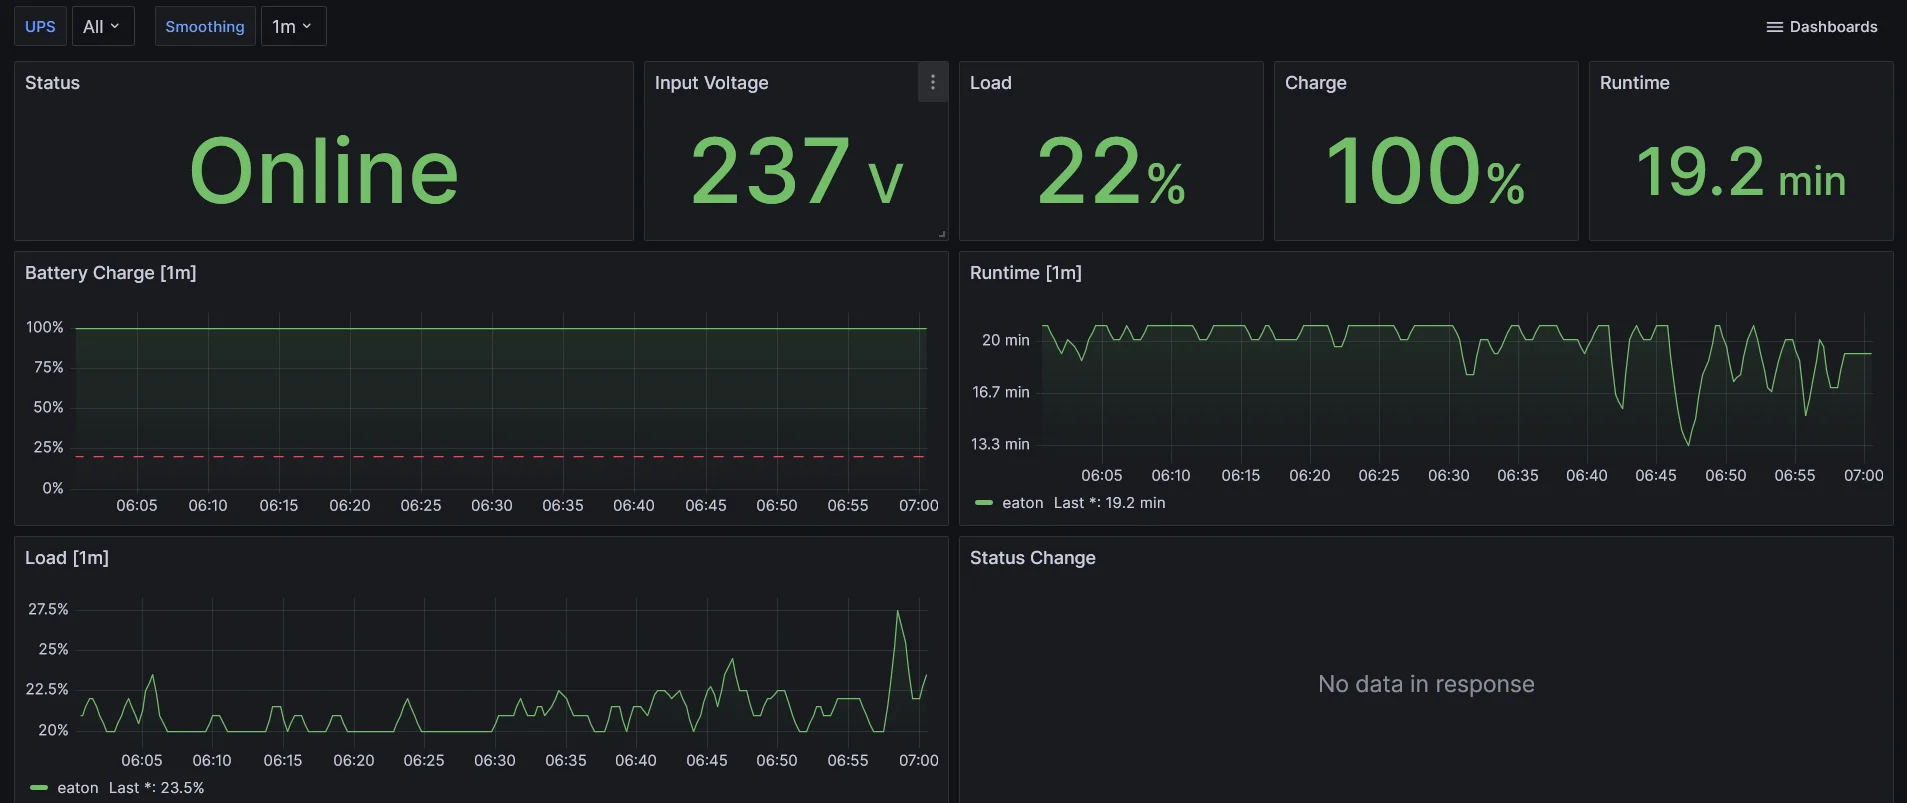
NUT
Global

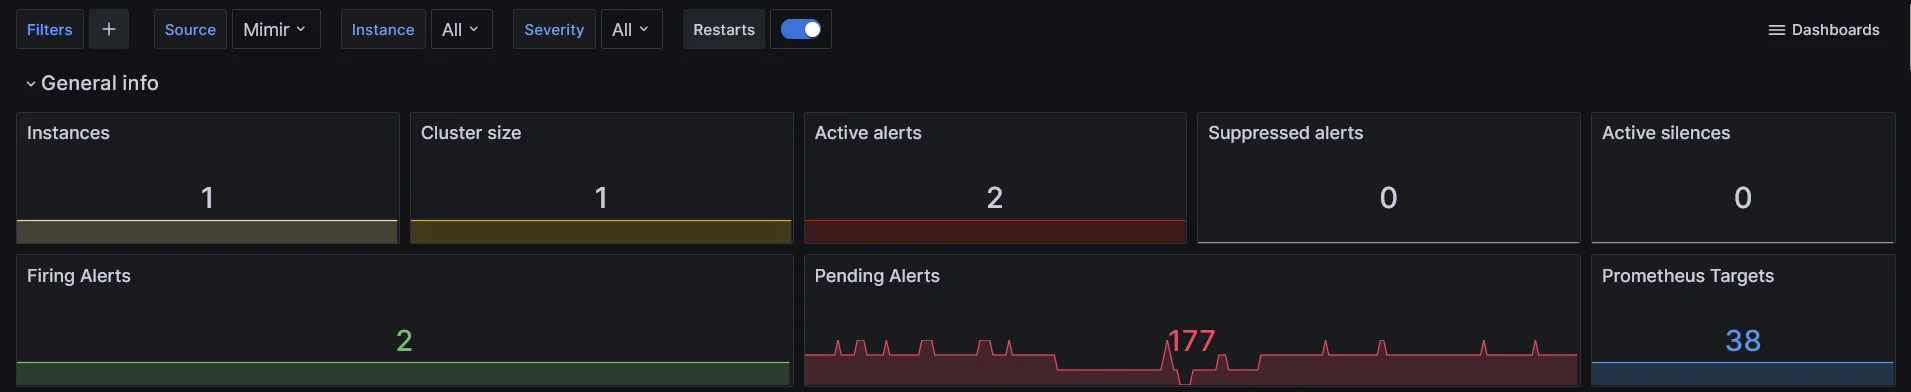
Alerting
prom/alertmanager
 Json
Json
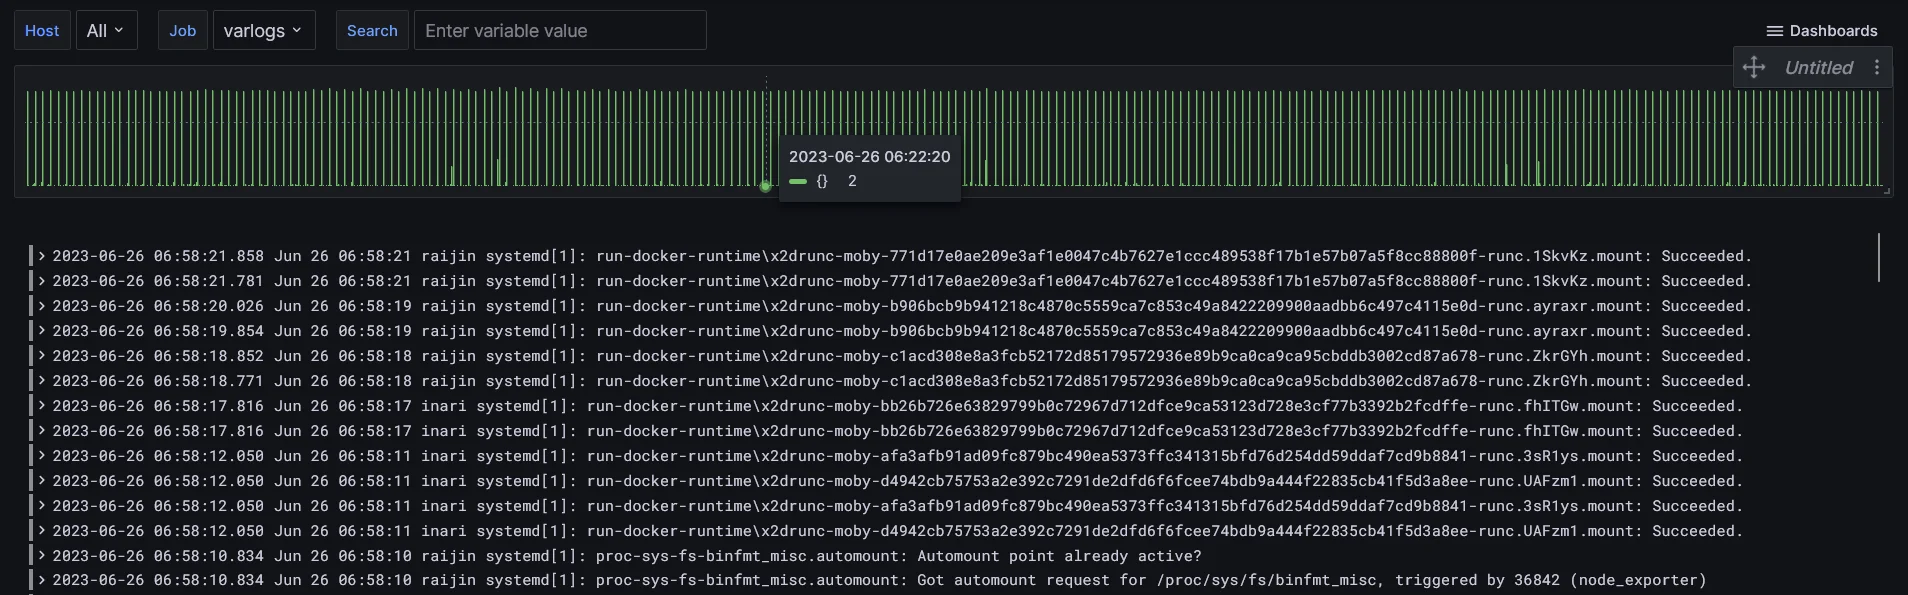
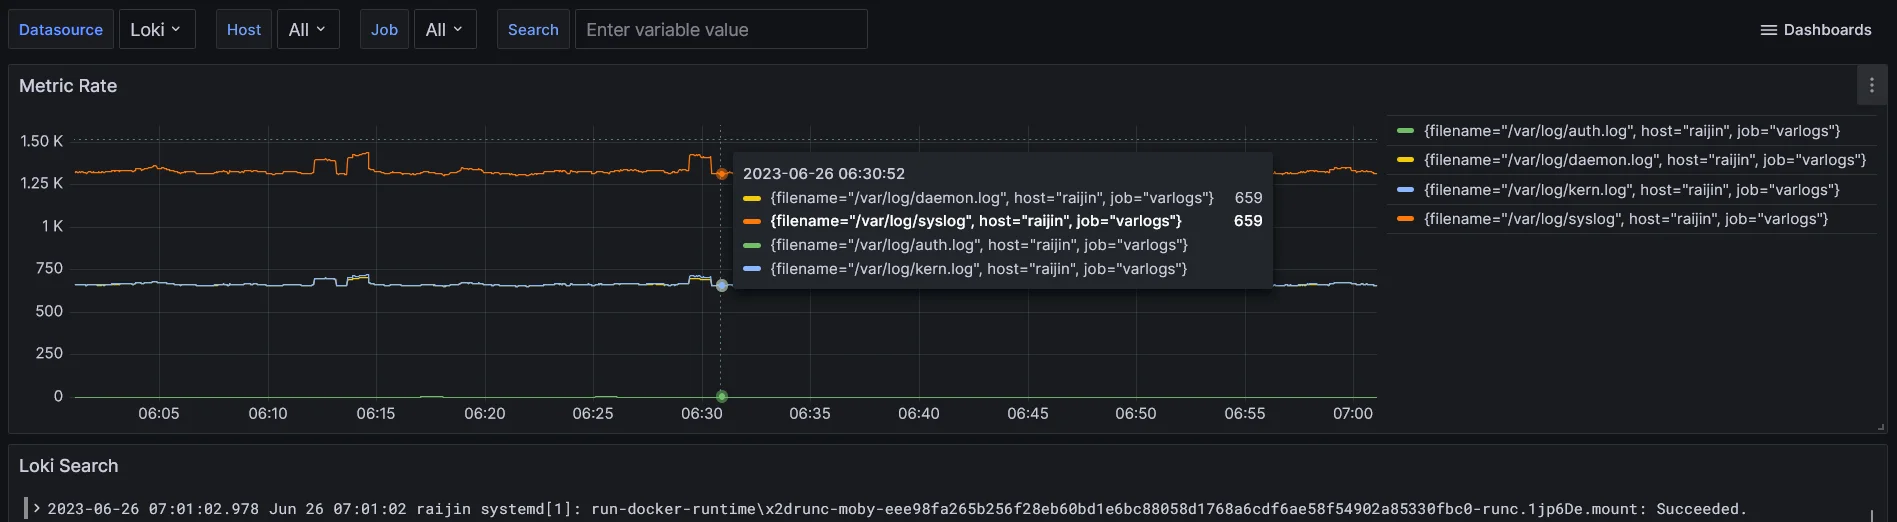
Logs
victoriametrics/victoria-logs
 Json
Json
Adguard Home
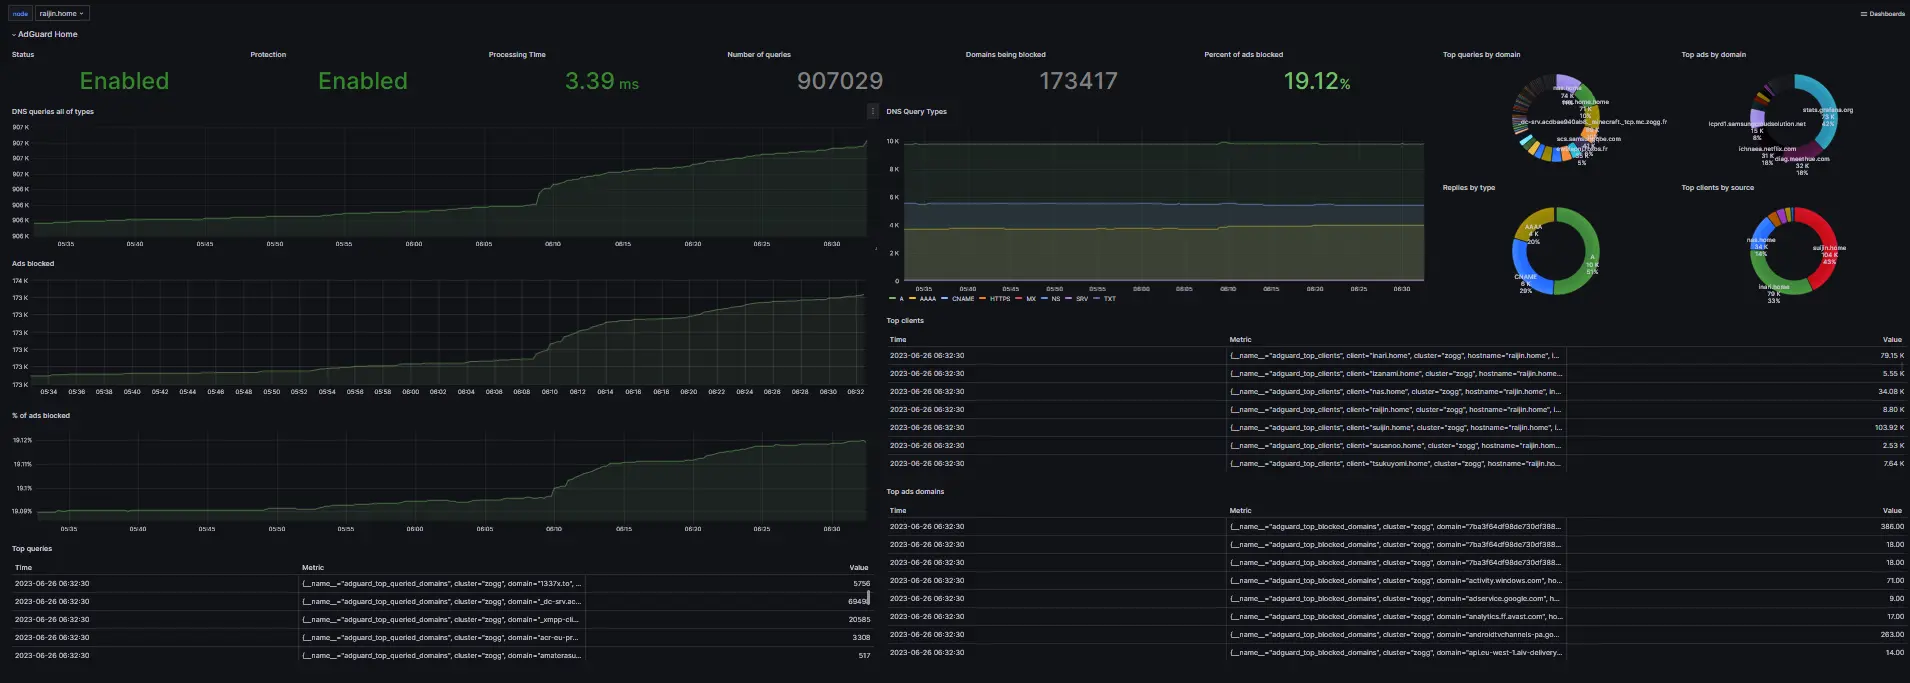
Details
Instant
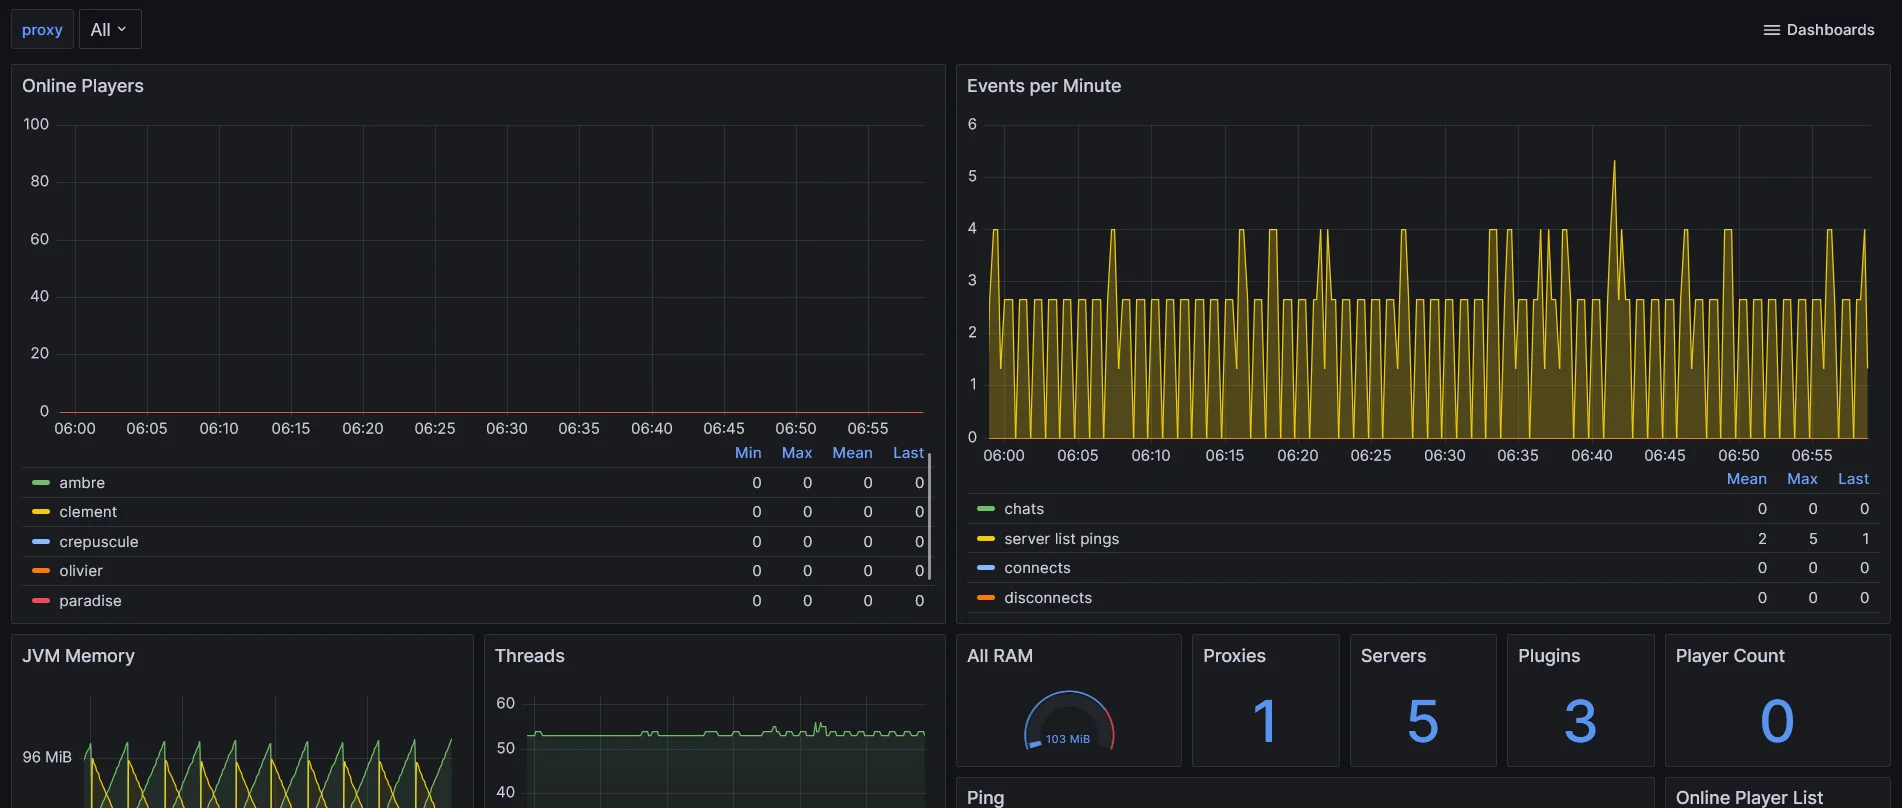
Minecraft
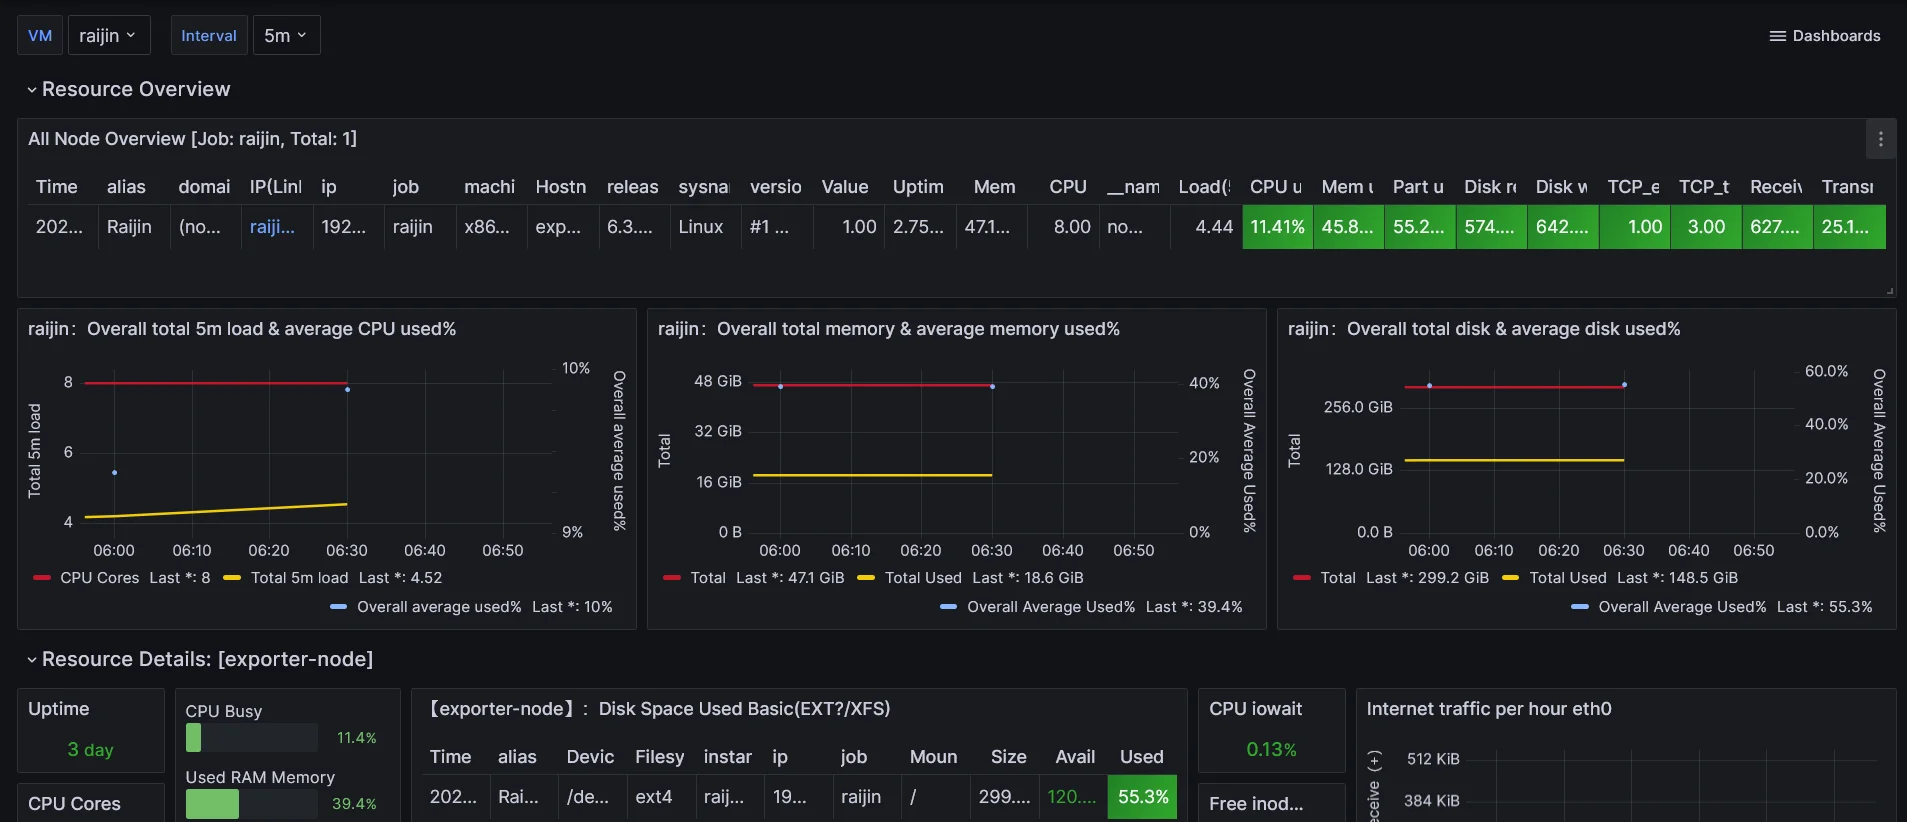
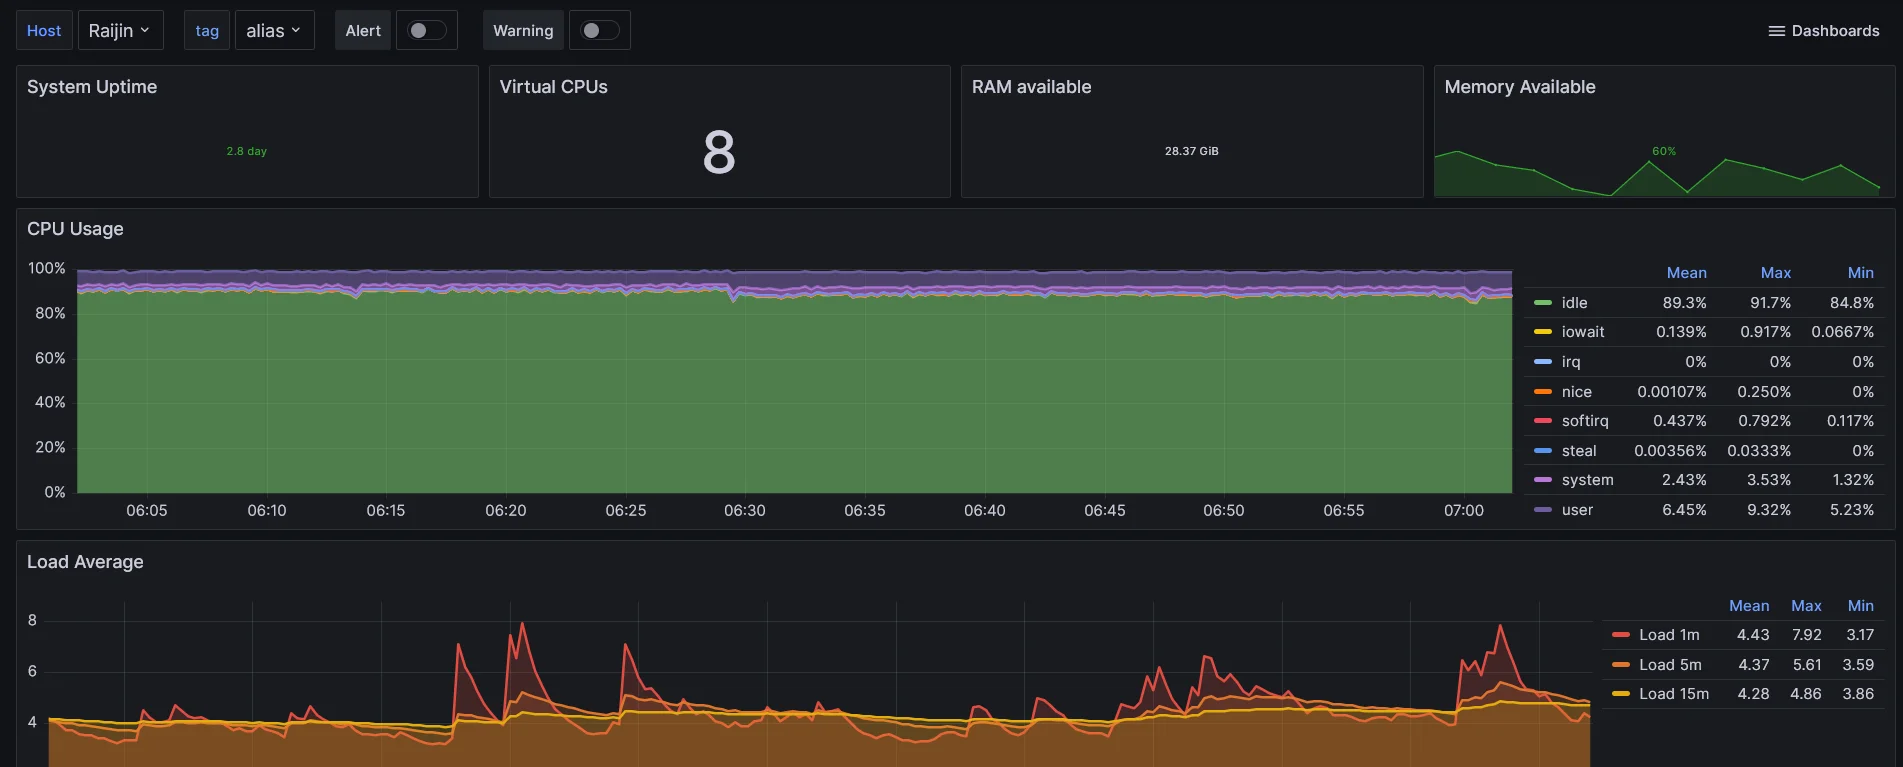
Monitoring
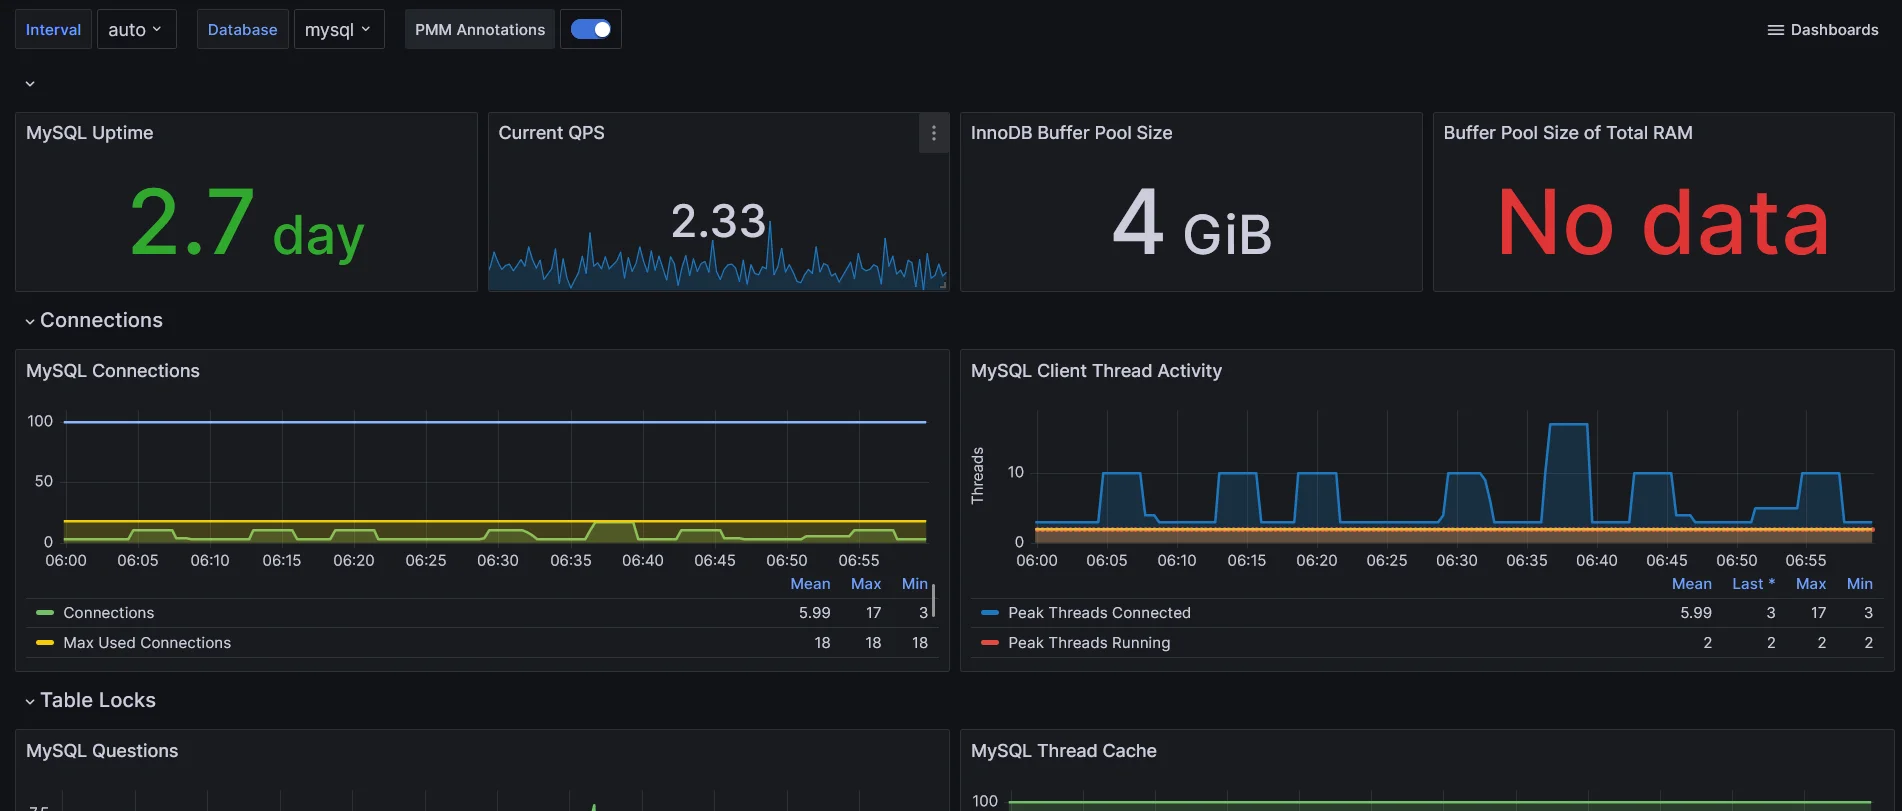
MySQL & MariaDB
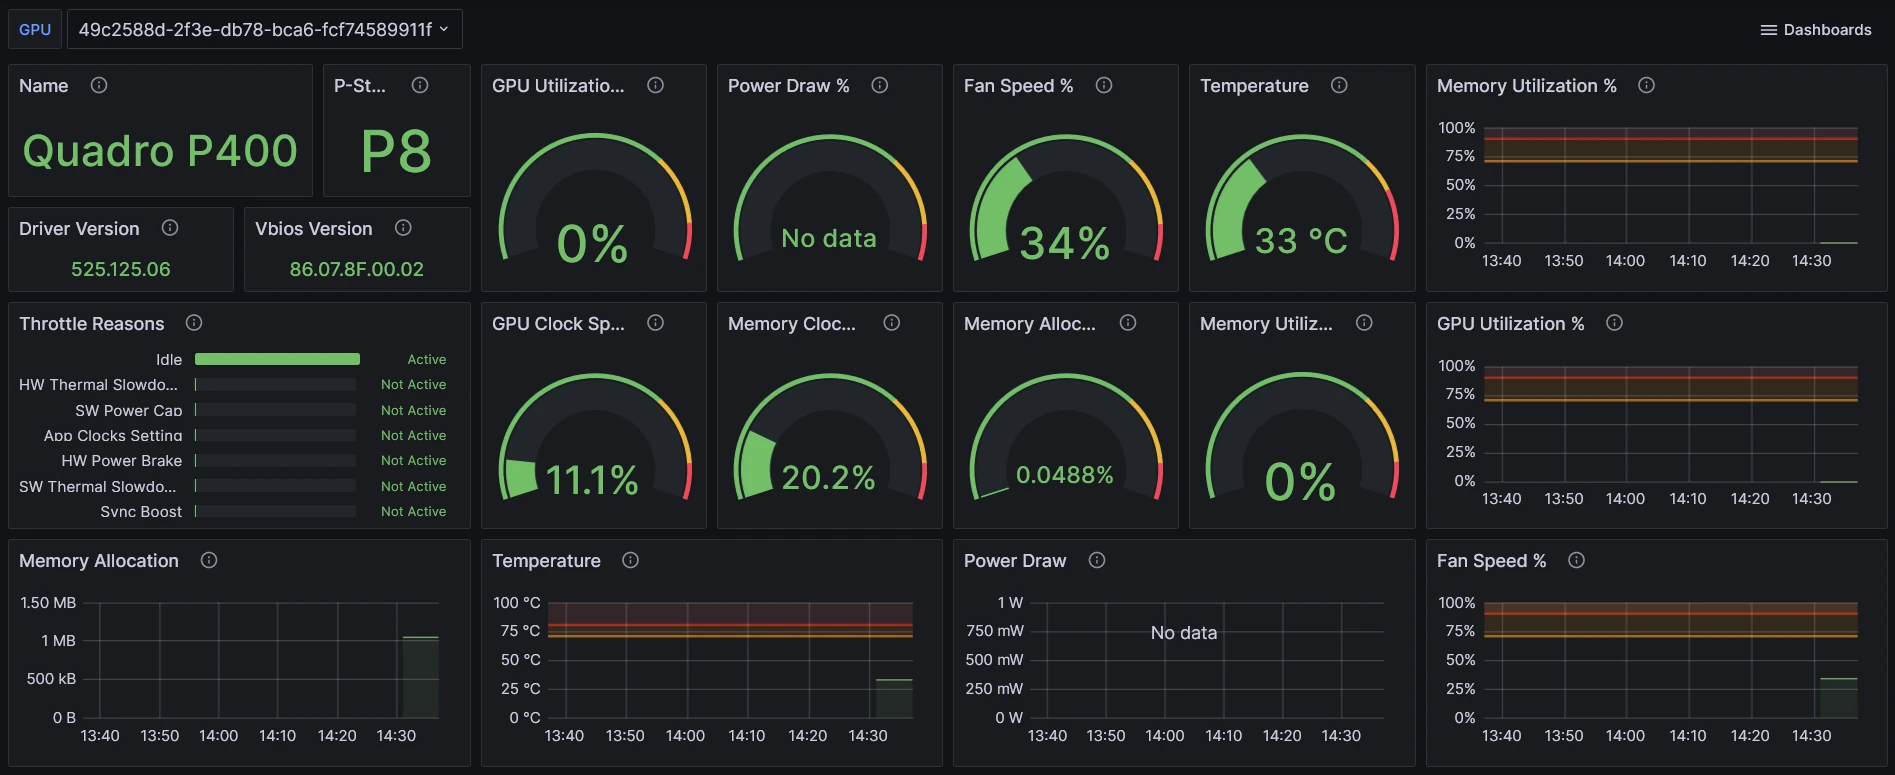
NVIDIA GPU
Parser
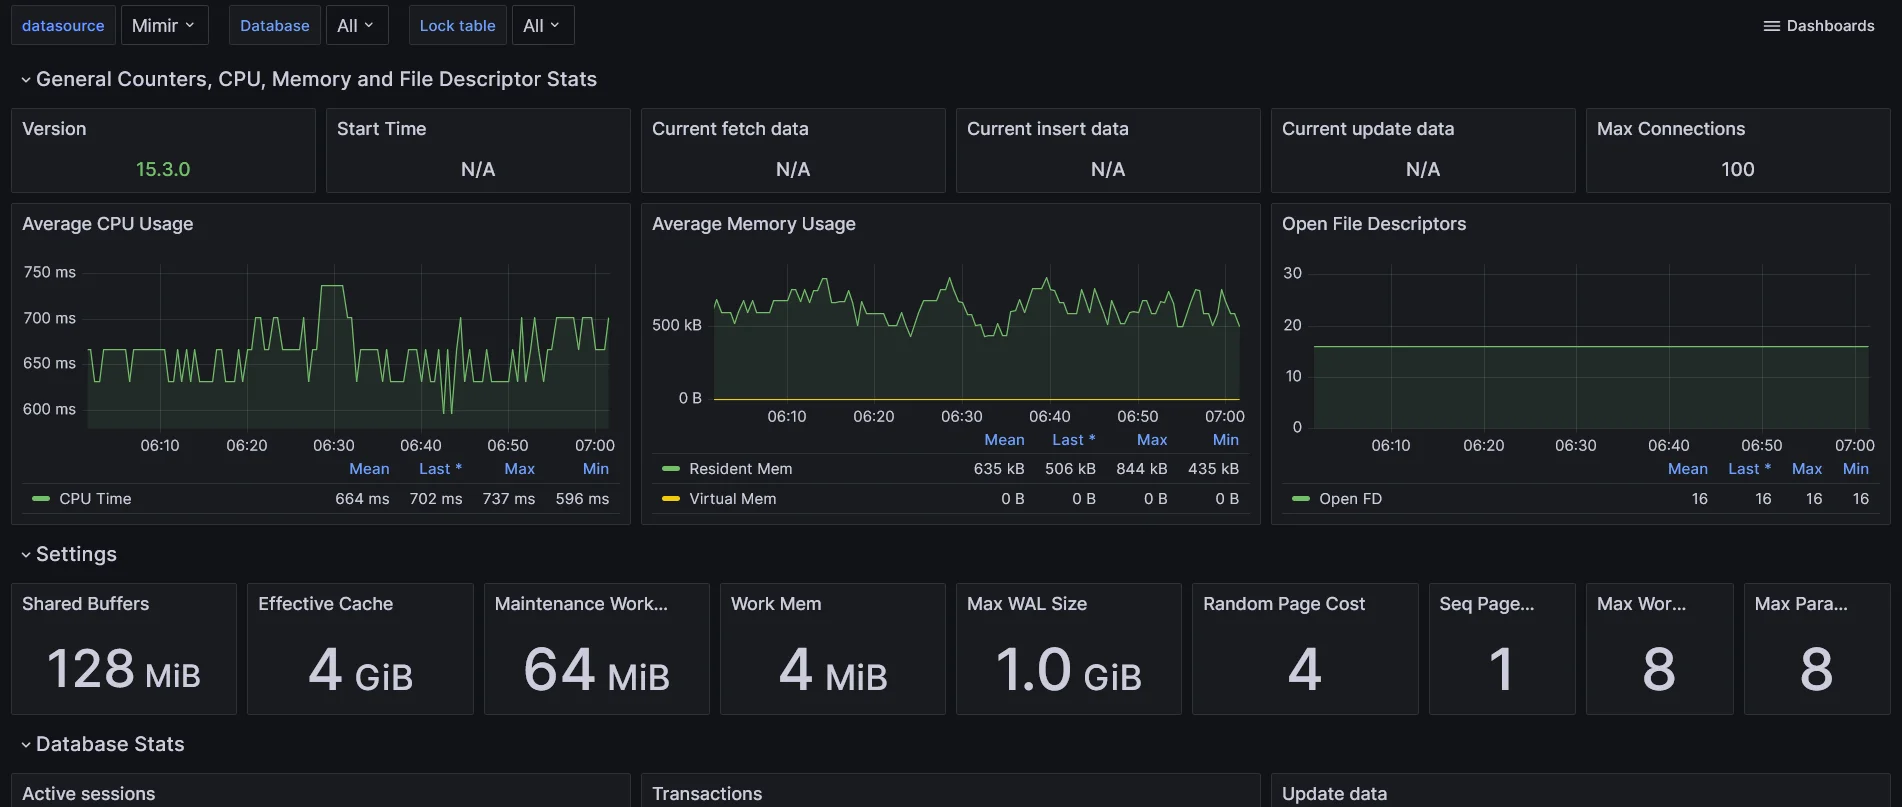
Postgres
Prometheus
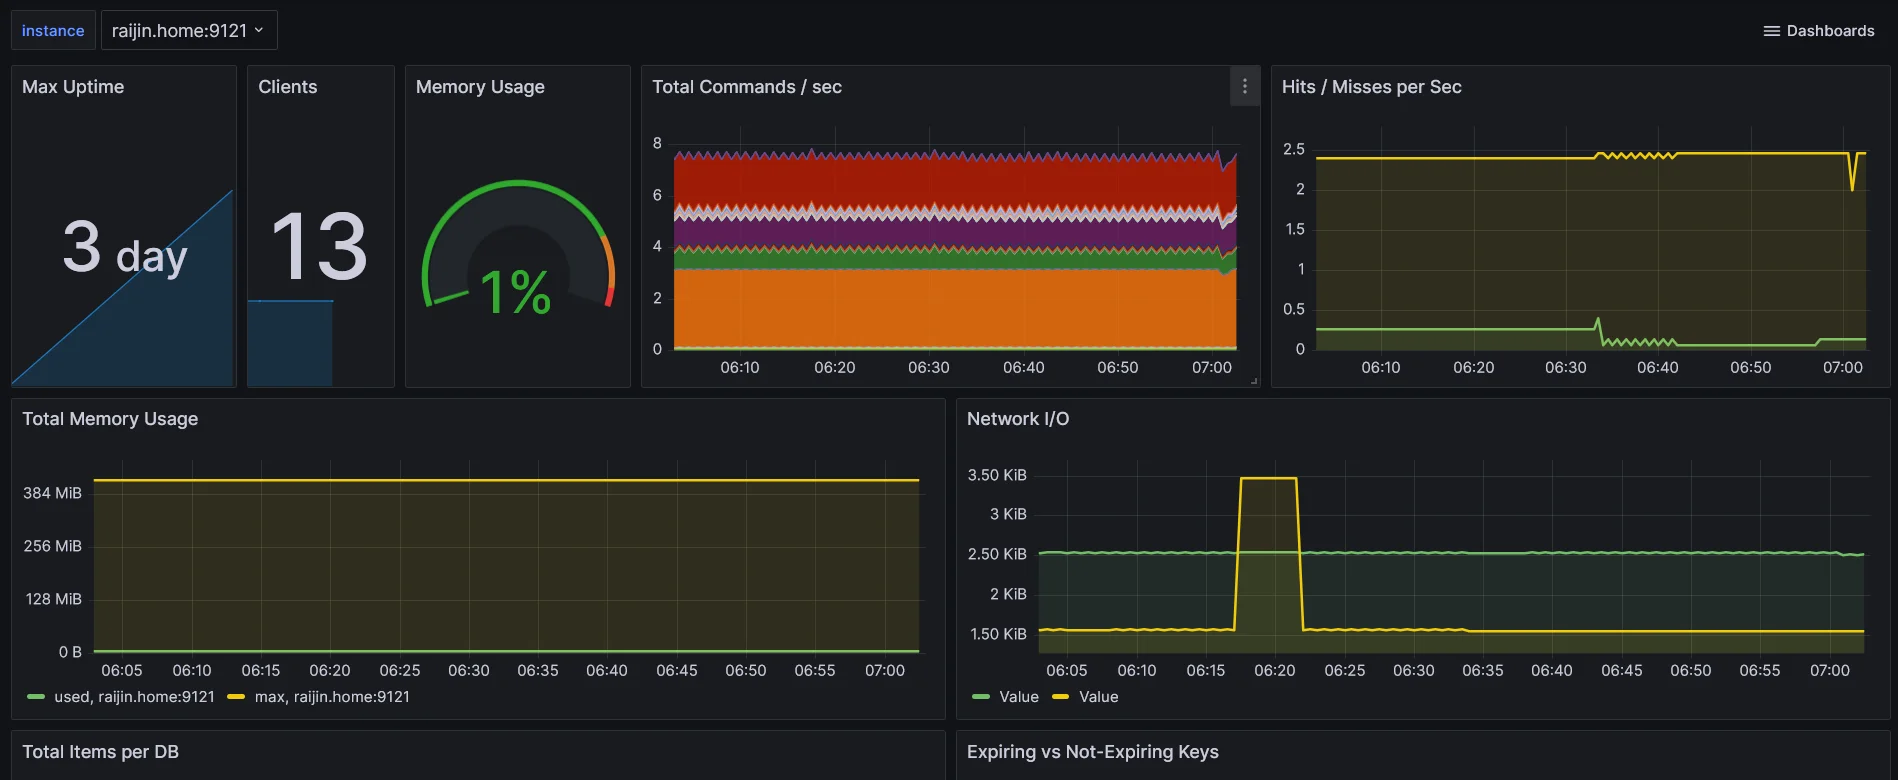
Redis
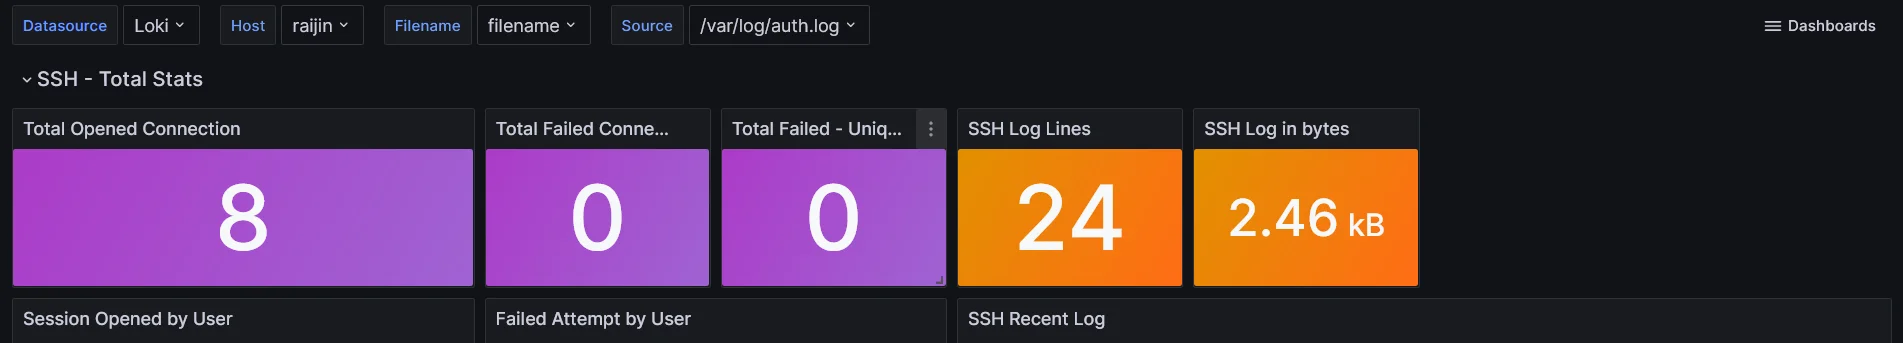
SSH
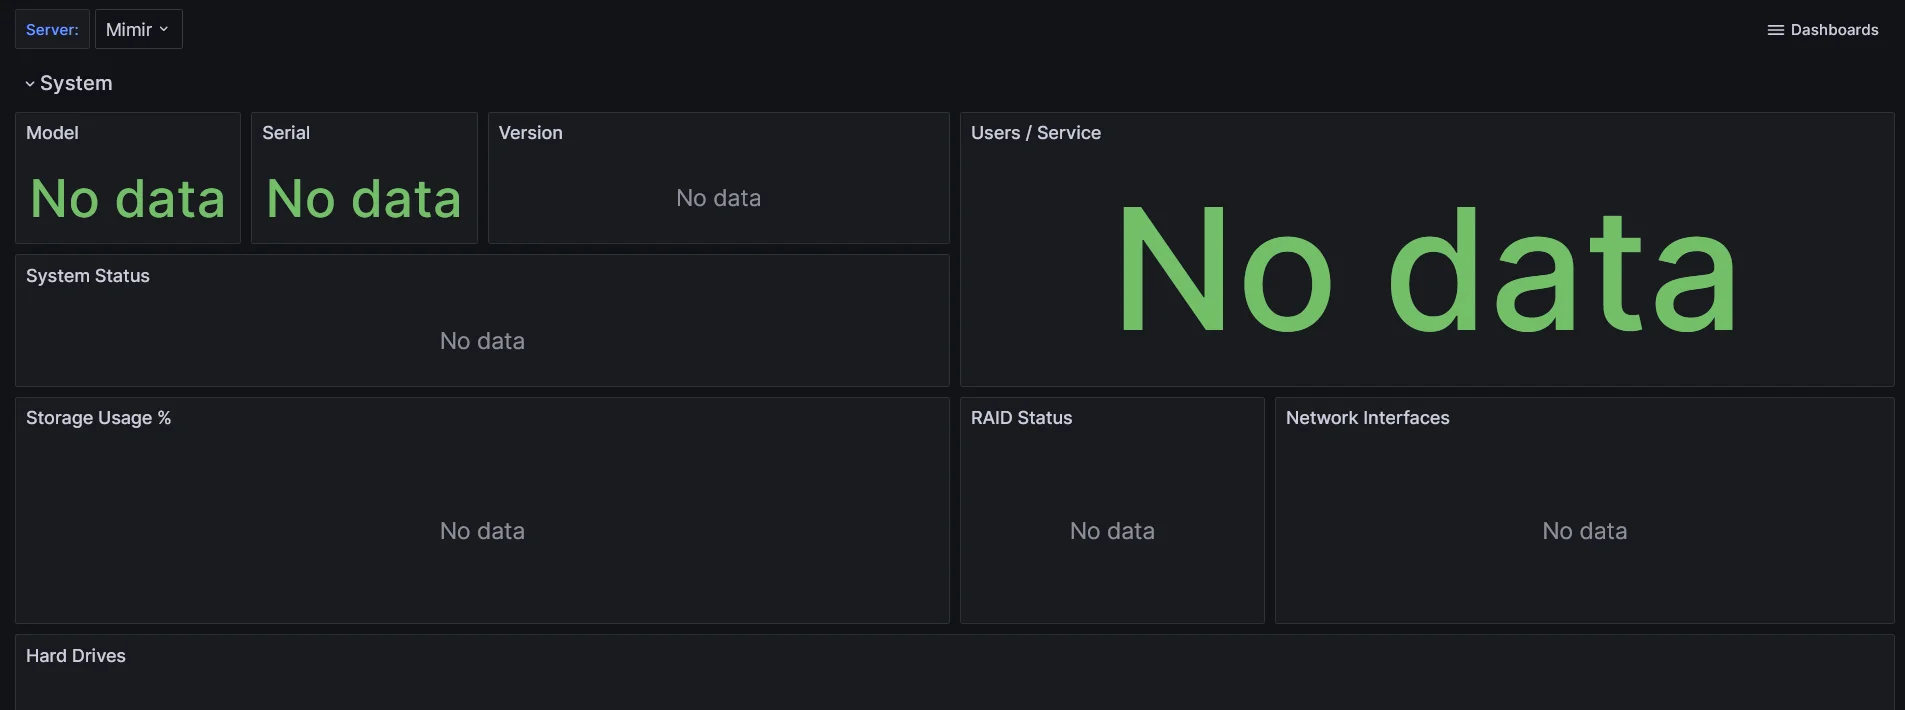
Synology
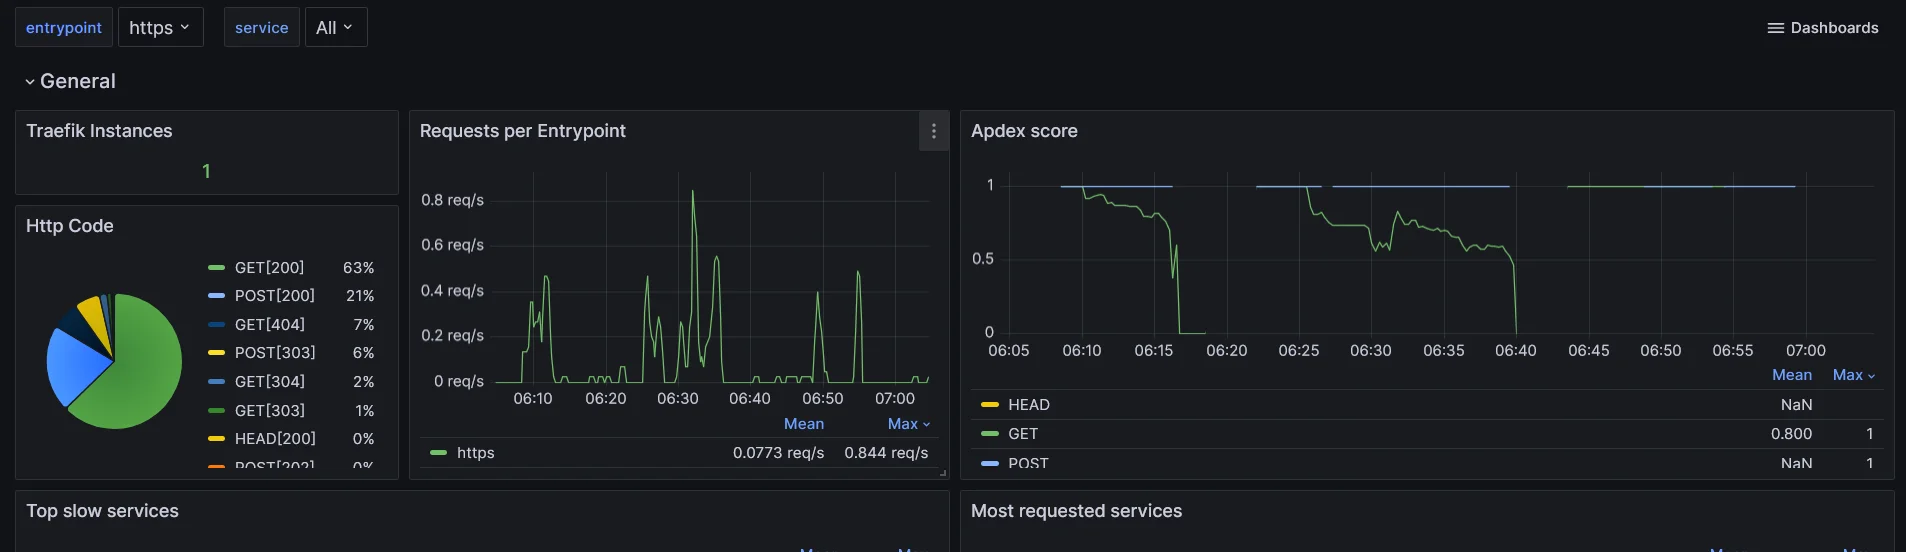
Traefik
Traefik Codes
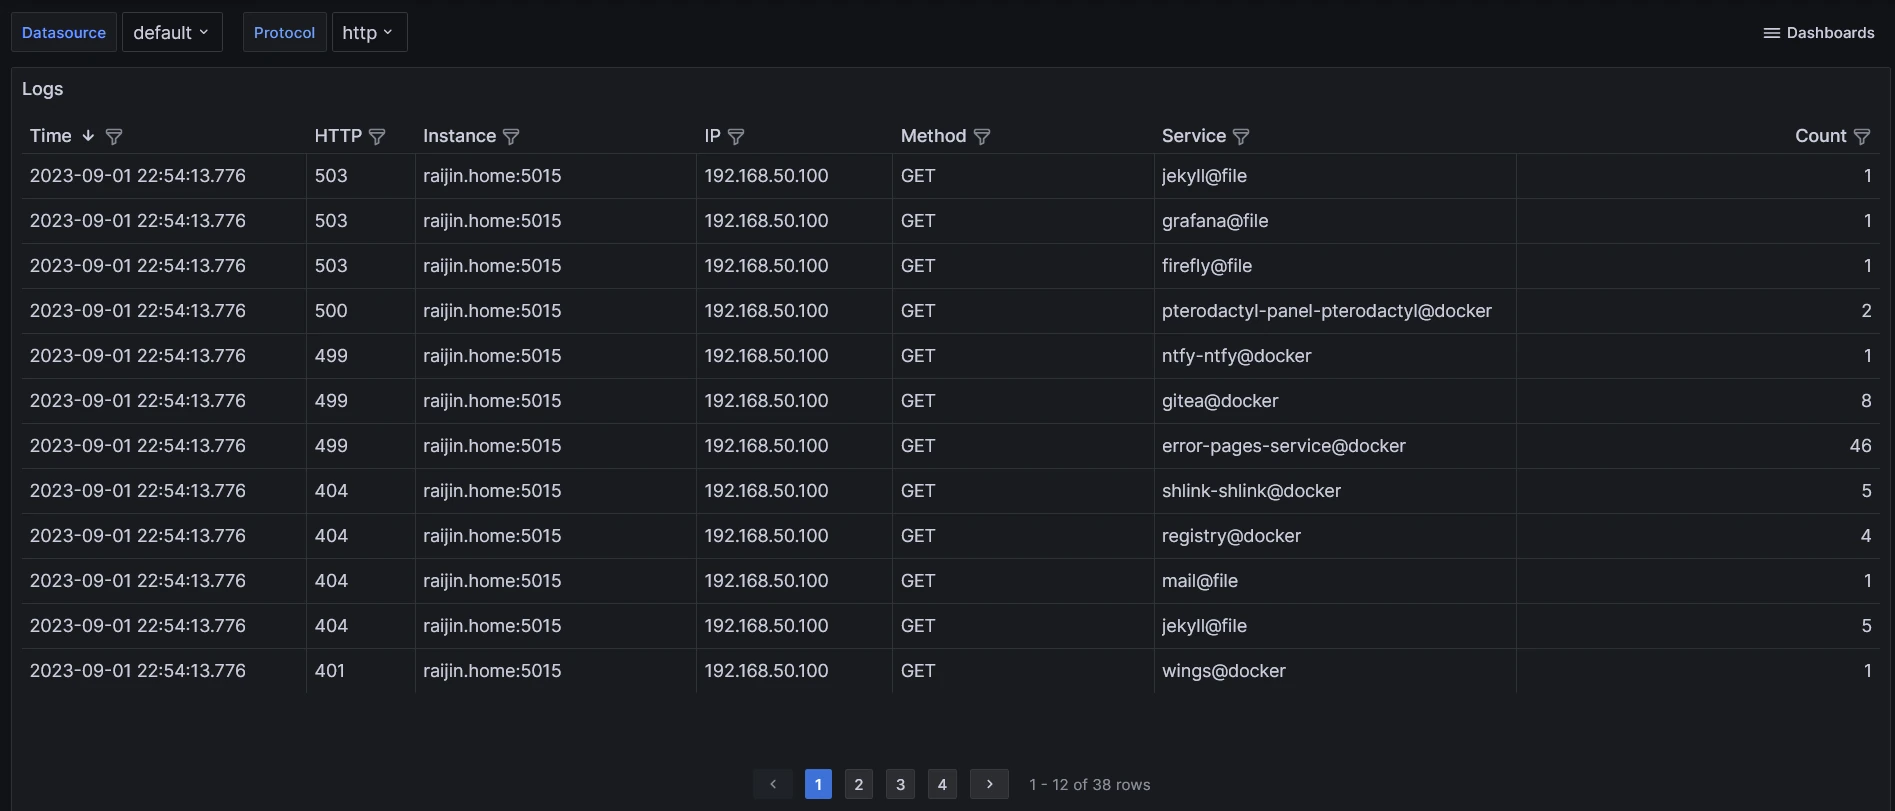
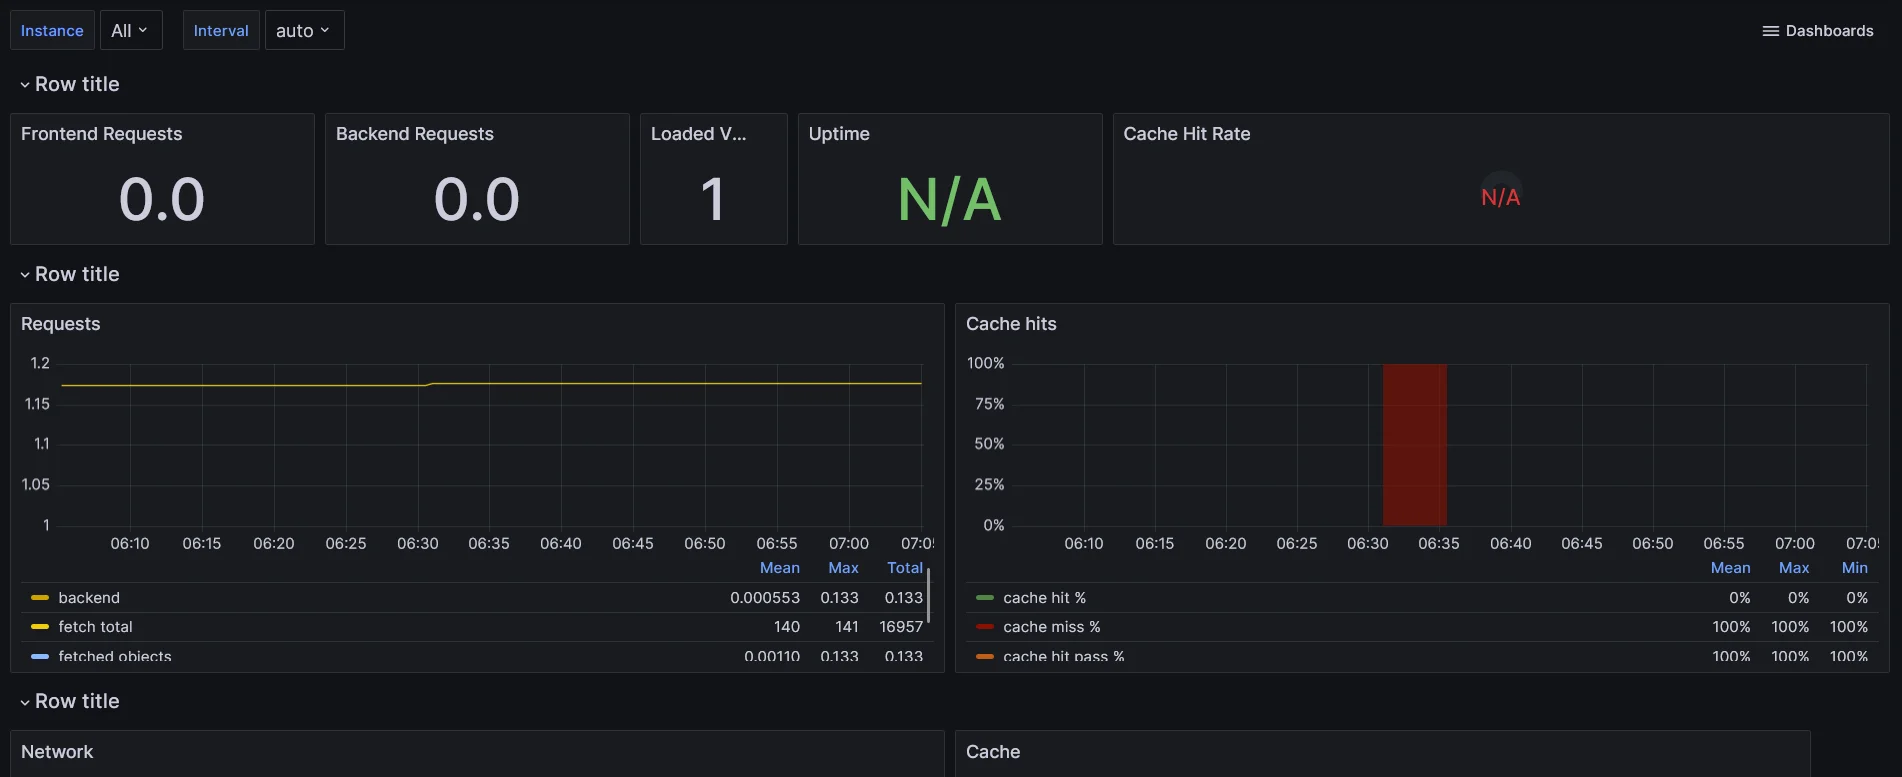
Varnish
HAProxy

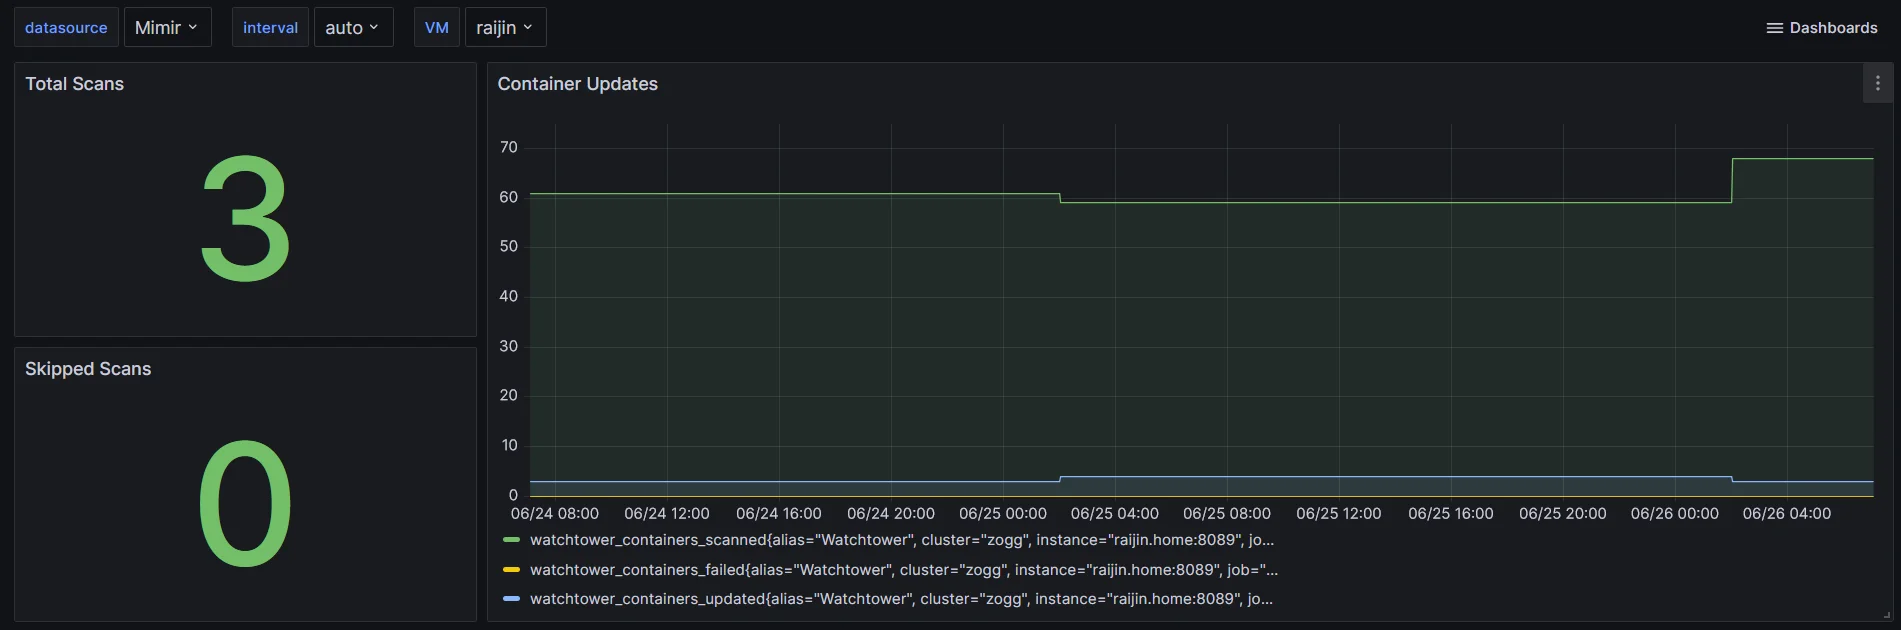
Watchtower
Changelog
2026-06-12
- J'ai enfin eu un peu de temps pour me repencher sur ce dépôt
- Une partie des Dashboard ne sont probablement plus fonctionnels
- J'ai mis à jour avec ceux en utilisation actuellement